Same AFS, Different Results: How Thermal-Expansion Curves Drive Veining and Dimensional Drift

1) Why AFS alone is not predictive
AFS (or D50) is a convenient particle-size midpoint, but it says little about:
-
Temperature-dependent expansion of the sand skeleton
-
Elastic vs. inelastic strain accumulation during thermal shock
-
PSD tails (D10/D90) that change packing and stress transfer
-
Binder and coating interactions that amplify micro-cracking
Two sands with AFS = 50 may show 2–3× differences in micro-strain through the 600–900 °C window, yielding starkly different veining incidence even under identical pouring conditions.
2) The physics in one picture
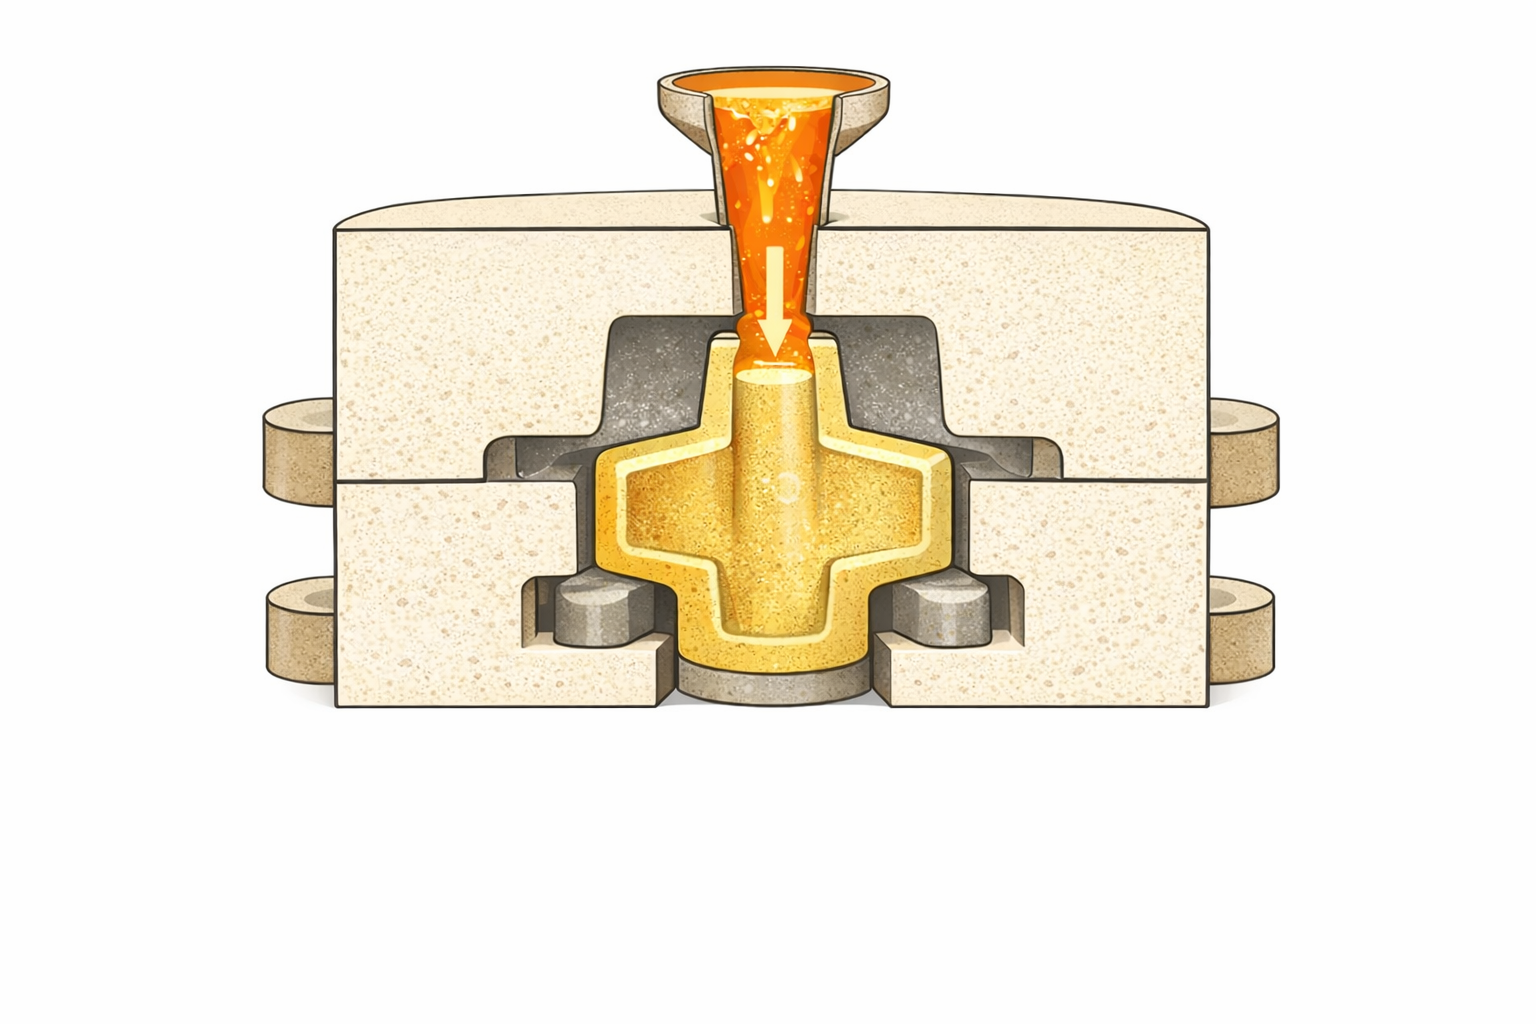
Imagine a simple band-mold constrained by a core box. As liquid metal raises the surface temperature, the near-face sand tries to expand while the interior is cooler and restrains it. The resulting tensile stress peaks when the sand’s thermal expansion rate (dε/dT) is steepest. If that peak coincides with binder softening or coating micro-cracks, stress relief occurs as veins—thin fissures that print into the metal.
What matters most is curve shape:
-
Low(ish) overall expansion is useful, but
-
A flatter slope (reduced Δε/ΔT from 650–900 °C) is what suppresses crack initiation, all else equal.
3) Measuring it correctly: from CTE to full curves
Method: Use dilatometry on compacted sand specimens (or bonded cores) to record ε(T) from ambient to ~1,000 °C at 5–10 °C/min.
Report not just a single CTE but the full set:
-
ε(T) at 100 °C increments
-
dε/dT (expansion slope) and its peak value
-
T* (inflection temperature) where slope changes sign or drops sharply
-
Hysteresis on cooling (irreversible strain, Δε_irrev)
Recommended acceptance line (example for aluminum core work; refine locally):
-
Peak dε/dT ≤ defined threshold in 650–900 °C
-
Δε_irrev after one heat cycle ≤ X% of total ε
-
Curve repeatability (R&R across lots) within ±10%
4) A practical test matrix you can run next week
A. Materials
-
Sand A and Sand B, both AFS ≈ 50 (or your standard)
-
Same core recipe, same coating thickness and dry-out
B. Measurements
-
Dilatometry: ε(T), dε/dT, T*
-
Core mechanicals: shell strength at 200/300 °C
-
Casting trial (paired molds): record veining % area, penetration score, Ra, release force
-
PSD tails: D10/D90 growth after 3/5 reclaim cycles, LOI vs. gas porosity
C. Analysis
Plot veining area vs. peak dε/dT; you’ll typically see a monotonic trend even when AFS and D50 are identical.
5) Reading the curve: what to look for
-
Steep mid-range slope (650–900 °C) → high tensile stress, higher veining probability
-
Early inflection (T* below ~700 °C) → stress capped sooner, often fewer veins
-
Large irreversible strain on cool-down → dimensional drift on subsequent cycles
-
PSD tail growth after reclaim → tighter packing near the face, amplifying stress
Rule of thumb
If two sands share AFS, choose the one with lower, broader peak in dε/dT across the 600–900 °C band—even if total ε differs only slightly.
6) Line controls that actually move the needle
-
Sand temperature (pre-mold)
-
Keep ΔT by shift < 5 °C; warm sand expands less abruptly and reduces micro-crack initiation.
-
-
Coating dry-out profile
-
Under-dried coatings store moisture and promote spall; over-dried, brittle coats crack under the same stress. Use weight-loss or IR checks.
-
-
Minimum viable binder
-
Excess binder increases LOI, gas, and local softening; reduce until gas porosity rises, then back off 5–10%.
-
-
Gating/velocity
-
Limit local impingement where the expansion slope peaks; match metal speed to coating and sand face strength.
-
-
Reclaim stability
-
Track PSD tails and LOI at 3/5/8 cycles; cap fines or blend new/add-back to hold dε/dT repeatable.
-
-
Cooling path symmetry
-
Uneven cooling turns expansion into bending; add local chills or adjust risers to avoid hot-spot asymmetry.
-
7) Case vignette (illustrative)
-
Two sands: both AFS = 50, identical D50; Sand-A shows peak dε/dT 1.3× higher between 720–860 °C than Sand-B.
-
Trial: same core design and coating; 40 paired pours on an aluminum pump housing.
-
Results: Sand-A veining area median 1.8%, Ra 6.4 µm; Sand-B veining 0.6%, Ra 5.1 µm. After 5 reclaim cycles, Sand-A fines ↑1.5 %, dε/dT peak shifts +20 °C; Sand-B stable.
-
Conclusion: the curve shape and its stability across reclaim cycles, not AFS, predicted the defect delta.
8) What to put in your weekly dashboard
-
Peak dε/dT (from periodic lab runs) with lot traceability
-
Sand temperature by shift, target band and alarms
-
PSD tails (D10/D90) and fines % after reclaim
-
LOI, Ra, veining % area, machining minutes per part
-
Out-of-window count (number of specs exceeded per 100 molds)
9) Suggested visuals for your article/page
-
Overlay of ε(T) and dε/dT for two sands with AFS = 50
-
Box plots of veining % area by sand type and reclaim cycle
-
Diagram of stress formation near the mold face with coating micro-cracks
-
Control-chart snippets for sand temperature and PSD tails
10) Key takeaways
-
AFS is a necessary but insufficient descriptor for casting behavior.
-
Thermal-expansion curve shape—especially the slope peak in the 600–900 °C band—tracks closely with veining and dimensional stability.
-
Bring ε(T) data, PSD tails, LOI, and sand temperature into one control stack; that is how foundries turn “measured” into managed.
Mini-FAQ
Q: Do I need a dilatometer to start?
A: It helps, but you can begin by correlating veining area, Ra, and reclaim-cycle PSD tails; when patterns emerge, lab curves explain the “why.”
Q: Is lower total expansion always better?
A: Not always. Slope and inflection timing matter more than the absolute endpoint.
Q: How often should we re-characterize curves?
A: At least per new supplier lot or when reclaim mix changes beyond a set threshold (e.g., ±10% fines).
Resin-Coated Sand (RCS) Plants, Unfiltered: Defect Mechanisms and a Repeatable Process Window
Technical News | From Materials to Process Windows: A 2024–2025 Technical Map of Foundry Sands
Related Article